-
Professor Camill receives NSF grant to study arctic climate change
Via Carleton News,
“Northfield, Minn.—Phil Camill, associate professor of biology at Carleton College, has received a National Science Foundation grant of more than $400,000 to study climate change in the Canadian Arctic.
Camill, a specialist in global change ecology, will undertake the project with three colleagues: Charles Umbanhower, professor of biology and environmental studies at St. Olaf College, Christoph E. Geiss, associate professor of physics and environmental science at Trinity College (Conn.), and Mark B. Edlund, senior scientist at the Science Museum of Minnesota. The overall project has been funded at $775,000; Camill’s portion of the grant represents the lion’s share at roughly $412,000 for three years of work.
The project’s goal is to improve the scientific understanding of how landscapes (the geographical location of a site, such as being upland or lowland and the abundance of peat-forming wetlands) mediate the responses of lake and terrestrial ecosystems to climate change. The study will look at more than two-dozen sites in the forest-tundra region of northern Manitoba, a region experiencing some of the fastest rates of warming in the world. Warming in Arctic regions is expected to cause large ecosystem changes, including increases in lake productivity, permafrost thaw, shrub expansion, and northward shifts in the sub arctic tree line. However, preliminary work in these sites by Camill and colleagues suggests that landscapes with high abundance of acidic wetlands may alter lake chemistry enough to influence how lakes respond to climate change. The project will test these ideas by examining the relationship between modern lake chemistry and landscape attributes as well as lake and peat land sediments over the past 8,000 years.”
-
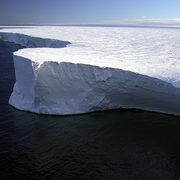
Though the most recent data concerning Arctic sea ice melting has received attention in the media, it is hard for most to grasp what “record melting” means. “Record melting” is difficult to show in one simple figure and to understand in a historical context. In the New York Times, two weeks ago, the Science section put up a great interactive graphic which really demonstrates how quickly the ice is melting. I strongly recommend that you check this feature out.
Continue by clicking the “read more” link below
Categories
- Building and Planning
- Carleton's Wind Turbines
- Climate Change
- Conferences
- Cowling Arboretum
- Ecosystem Management
- Emissions and Offsets
- Energy Sources & Uses
- Environmental Justice
- Events
- Food
- Higher Education
- International News
- National News
- News
- STA Program
- Student Life
- Student Projects
- Sustainability
- Sustainable Planning & Development
- Transportation
- Waste