For packages not covered here, check out the RStudio Cheatsheets.
General R/RStudio/Mirage/R-Cloud Questions
What is R/RStudio?
As the R website states, “R is a language and environment for statistical computing and graphics” that “provides a wide variety of statistical and graphical techniques.”
RStudio is an integrated development environment (IDE) for R; it provides all the important tools people use when writing R code.
Installing R/RStudio
What is Mirage?
Yihuang, a former member of Carleton’s DataSquad, wrote a nifty article on Carleton’s own RStudio server, which also provides several links to useful resources for learning R.
What is RStudio Cloud?
Unlike Mirage (Carleton’s RStudio server), RStudio Cloud is a cloud version of RStudio that is accessible online from any network. It can be used to edit R documents shared with collaborators.
R Scripts vs. R Markdown file
- An R script is a text file with a list of R commands that are run in order when executed.
- An R Markdown file is an interactive document where R commands can be run in chunks, making debugging easier. It can also be knit so that the result of your R commands is made into a pdf file.
Other Resources for Learning R
Check out Carleton R resources suggested by the Math and Stats department or scroll to the end of Carlpedia’s entry on R/RStudio.
Aside from Carleton resources, Stack Overflow, R documentation.org, and statmethods.net are all legit places to search for R help. You can search up your question on Google first, and then search for answers from these sources.
Dplyr Specific Questions
How to use dplyr mutate():
We will use the dataset mtcarsfor the demo. mtcars is a built-in R dataset stored in Base R. It’s a long list of cars; I only show the head of this dataset.

How can you add another column that shows the number of “mpg per cylinder”? You can use mutate() from package: dplyr.
The syntax of mutate():
[DataFrame] %>% mutate([newColumnName] = [value for that new column])
If you don’t know a pipe (%>%), check out the FAQ right below!

There is a little problem, however: rowname (original car names) is replaced by index numbers. If you want to keep rownames, make the rownames into the first column. You can do:
[DataFrame] %>% rownames_to_column(‘[newColumnName]’) from the package: tibble.

If you don’t want to use pipe (%>%) for mutate(), you can also use this syntax:
[DataFrame] <- mutate([newColumnName] = [value for that new column])
How do I use a pipe (%>%) in the context of tidyverse?
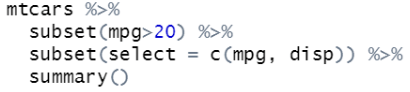
I use mtcars, a built-in data frame in R, for demo. A pipe passes down the current object (table, list, graph, etc.) so you can do something to that object (such as filter, subset, add, etc.). You can then pipe again if you want to do something to the resulting object. In this example, I filtered my data frame twice, and then summarized it.
If you want the final output of the pipe(s) to be an object, you simply add “->” to the last command:


How do I merge two datasets? (resources and example)
Merging is a complicated topic. If you are interested in learning how to precisely manipulate data, you may want to take the data science class offered in the Math and Stats department. For a quick guide, take a look at this tutorial in datacamp, an online platform for learning data science.
Here is an example of 3 types of simple merges from Carleton DataSquad. It’s in this tab because it’s kinda long.
How to replace NA values as median/mean (with mutate)?
Before you do anything, you should think hard before imputing missing values. Replacing missing values with another statistic like the mean can artificially reduce the variance of your data. It may be better to exclude missing values from your analysis, which is what most functions in R do by default.

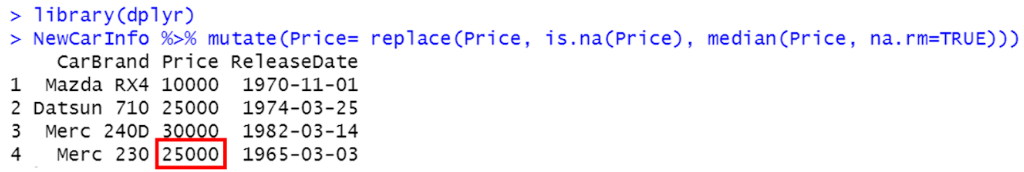
Say I have a table called NewCarInfo. For ‘Merc 230’, the Price is ‘NA’, and I want to replace that ‘NA’ value with the median of other cars’ price (the median of 10000, 25000, 3000). You would need dplyr, a common tool for R data wrangling. Then, you will use this syntax:
[DataFrame] %>% mutate([column name to modify]= replace([column name], is.na([column name]), median([column name], na.rm=TRUE)))
‘na.rm=TRUE’ means that when we calculate the median (or mean), we will remove ‘NA’ values. If you are confused about what “mutate()” and %>% are, look at the FAQ above.
For our example, [column name to modify] is ‘Price’. So after executing the code,
In this example, I make a new column called ‘PriceModify’, and put the modified column there. I also use mean instead of median to replace the NA value.

How to replace NA values in a dataframe with arbitrary values (with mutate)?
Before starting, you should think hard before imputing missing values. Replacing missing values with another statistic like the mean can artificially reduce the variance of your data. It may be better to exclude missing values from your analysis, which is what most functions in R do by default.
If you know for sure that all of your missing values should be replaced with a singular value, you can use the following code:


If you want more detail explanation of the code, check out the FAQ right above (replacing “NA” with median/mean)
Specific Issues with R Code
I keep receiving the error: “Cannot open file ‘C:/Users/…’: No such file or directory”
By default, the R working directory is set based on your project location (where your R file locates). So, put all the files you need into the project folder.
However, sometimes error occurs, run getwd() in your console in RStudio to ascertain your working directory.
or you want to assess files that are outside of the project folder (not the best practice). You may use setwd(“C:/Users/…”) (quotation mark needed). to direct R to the desired folder.
What are packages, and how do you install/load a package?
R packages contain a set of R functions and data, usually serving a specific purpose. To use functions and data included in a package, you must install and load that package first.
Run install.packages(“somepackage”) in your console to install a package (replace somepackage with the name of the package you want to install, and make sure it is in quotation marks). Once a package is installed, you do not have to install it again when restarting R. However, you will need to load it after every session. To load a package, run library("somepackage")in your R code.
Adding labels to plots
How do you summarize regression results in a table?
I recommend using the package stargazer for this. Read this manual written by the author of the package.
How to filter data with Base R subset():
Base R’s subset() is a tool for filtering data. I’ll use the dataset mtcars for the demo. mtcars is a built-in R dataset. I only show the head of mtcars (it’s a long table).
The syntax of subset():
subset([DataFrame], [condition 1] & [condition2] | [condition 3]...)
Note: “ & ” means “and”. “ | ” (shift + right slash) means “or”

If you know how to use dplyr pipe (%>%), the syntax can be:
[DataFrame] %>% subset([condition 1] & [condition2] | [condition 3]...)
If you know dplyr filter(), you can learn more about it here [link].
Issues Regarding Data Types
Overview u0026amp; Resources
- Data types are often a source of confusion for novice R users, but they are an important part of cleaning your data and any subsequent analysis you will run on it. This link provides an overview of these data types (https://swcarpentry.github.io/r-novice-inflammation/13-supp-data-structures/).
- For creating a dataframe with columns of different data types, take a look at this tutorial from R Tutorial.
- For converting the data types of columns in a dataframe, check out this tutorial from Statistics Globe.
How do I declare data types when I create a matrix (table)?

By default, if you input a word list (as in PeopleName), R makes that a character list. If you put in a list of numbers (as in Income) without quotation marks (‘ ’), R makes that a numeric list. Mark in Red: If you put numbers into quotation marks (‘ ‘), numbers become factors. You can also use this command to manually define a character list/table.
You can also use this command to manually define a character list/table:
[List or Table] <- as.character(c(…))
The as.[something](c([a list])) format manually define other data types:
Some examples are: as.factor( ), as.numeric( ) and as.date( )
How do I check the data type in an R table?
First, type View([data]), another window will open. For the demo, I use “mtcars”, a built-in dataset in R, type View(mtcars) and you will see it.
A new window will open. Hover over the column name and you will see the data type of that column:

How do I change between different data types?
“Before you start, be aware that changing data type should be done with caution. There is usually a reason that something you think is numeric is read into R as, say, a factor or character” (cited from Prof. St. Clair)
This example uses the built-in R dataset mtcars. However, the built-in dataset is immutable, so I create Modified_mtcars, a copy of mtcars so that I can modify the copied table.

The mpg column of Modified_mtcars is originally numerical. I can convert it to characters with this command:
[DataTable]$[column name] <- as.character([DataTable]$[column name])


Then, I can change the data type of “mpg” back to “numeric” using:
[DataFrame]$[column name] <- as.numeric([DataFrame]$[column name])

If you wish to learn more about different data types and their conversion, check out Professor St. Clair’s tutorial.
How to convert factors to numeric without losing data?
“Factor” is a data type different from characters. Factors categorize the data and store it as levels (which can be both characters and numbers). Factors are used where there are a limited number of unique values (think of a histogram).
If you directly convert factors to numbers, R will treat each unique number as a name, and number the names with “1, 2, 3, 4…”. That’s probably not what you want.
Say, I create a dataframe “GoodsInfo”, and convert the factor column “Price” into numeric. “Price” will become:

This problem can be solved by doing parse_character() from library(readr) first, and then as.numeric():

Note: [DataFrame]$[column] <- as.numeric(as.character[DataFrame]$[column]) also works for converting factors to numbers. “In general, I prefer the parse_xxx commands in readr over as.xxxx because readr will give you warnings (in the form of a problem object) for unexpected parse probs” (cited from Professor St. Clair).
If you have further questions about factors, or data type conversion, check out Professor St. Clair tutorial.