The Northfield Undergraduate Mathematics Symposium (NUMS) is an annual event sponsored jointly by Carleton and St. Olaf. In 2014, five students spoke at the symposium on research they did around the country over the summer. The pictures at the right show the speakers in action, and below are the titles and abstracts of their talks, and in some cases links to their slides.
Uniquely Bipancyclic Graphs
Zach Walsh, Carleton
A bipartite graph on n vertices, n even, is called uniquely bipancyclic (UBPC) if it contains precisely one cycle of length 2m for every 2 ≤ m ≤ n/2. The concept of uniquely bipancyclic graphs was recently introduced by Dr. Walter Wallis of Northern Illinois University, who classified all UBPC graphs on at most 30 vertices. Namely, up to isomorphism, there is only one uniquely bipancyclic graph of order 4 and only one of order 8. There are precisely four uniquely bipancyclic graphs of order 14 and six of order 26. We used computer programs to show that if 32 ≤ n ≤ 56, and n ̸= 44, then there are no UBPC graphs of order n. We also found the six non-isomorphic UBPC graphs of order 44.
A Mathematical Approach to Uncovering Regulatory Mechanisms in Calcium Homeostasis
Ben Liska, St. Olaf
Calcium is a mineral essential to many systems of life. As such, the body regulates levels of calcium in the blood plasma very tightly through a process known as calcium homeostasis. The controlling mechanisms in this process include parathyroid hormone, calcitonin, vitamin D, and the mineral phosphate. Much research has been done on the biology of this system but it is not understood completely. Recently, work has been done to mathematically model this system, however, these models are very complex.
In this talk, we will provide a simplified mathematical model of calcium homeostasis that still captures biologically relevant mechanisms. Using the modeling software COPASI (Hoops 2006), we will show numerical simulations and comparisons to experimental data. An analysis of the stability of our nonlinear model provides insights into our dynamical system. We will conclude by showing ways we can predict how various diseases can disturb calcium homeostasis and provide suggestions for further investigation that could lead to effective treatments.
Chermak-Delgado Lattices of Metacyclic p-Groups
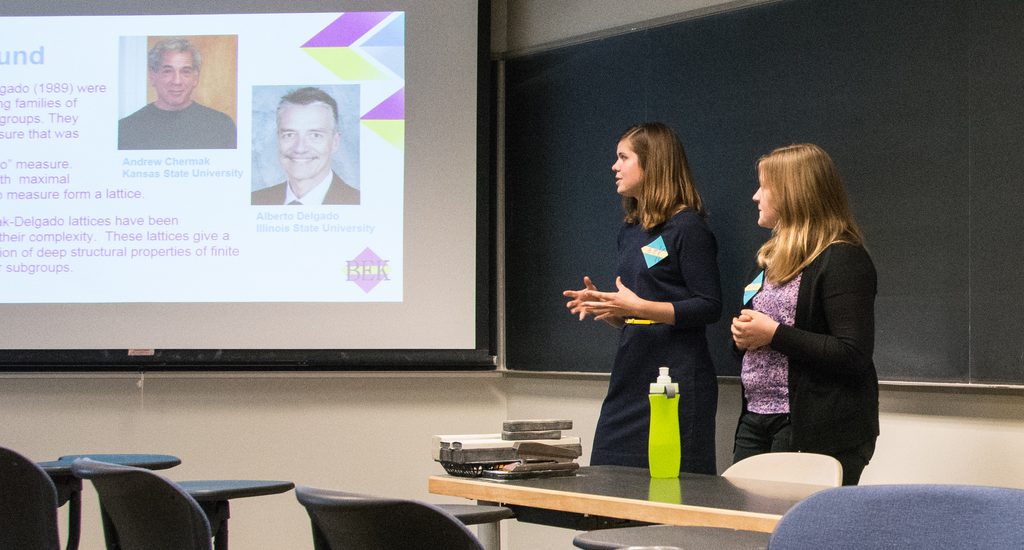
Kendra Johnson-Tesch and Brianne Power, St. Olaf
The Chermak-Delgado measure of subgroup H in a finite group G is defined as mG(H)=|H| |C_G(H)|. The subgroups with maximal Chermak-Delgado measure form a lattice of subgroups called the Chermak-Delgado lattice. This paper applies key properties of Chermak-Delgado lattices to split metacyclic p-groups. Moreover, we provide a complete Chermak-Delgado lattice for specific split metacyclic p-groups. Additionally, we describe a sublattice within the subgroup lattice of a split metacyclic p-group; we have reason to believe that this is a sublattice of the Chermak-Delgado lattice.
A Method for Combining Family-based Rare Variant Tests of Association
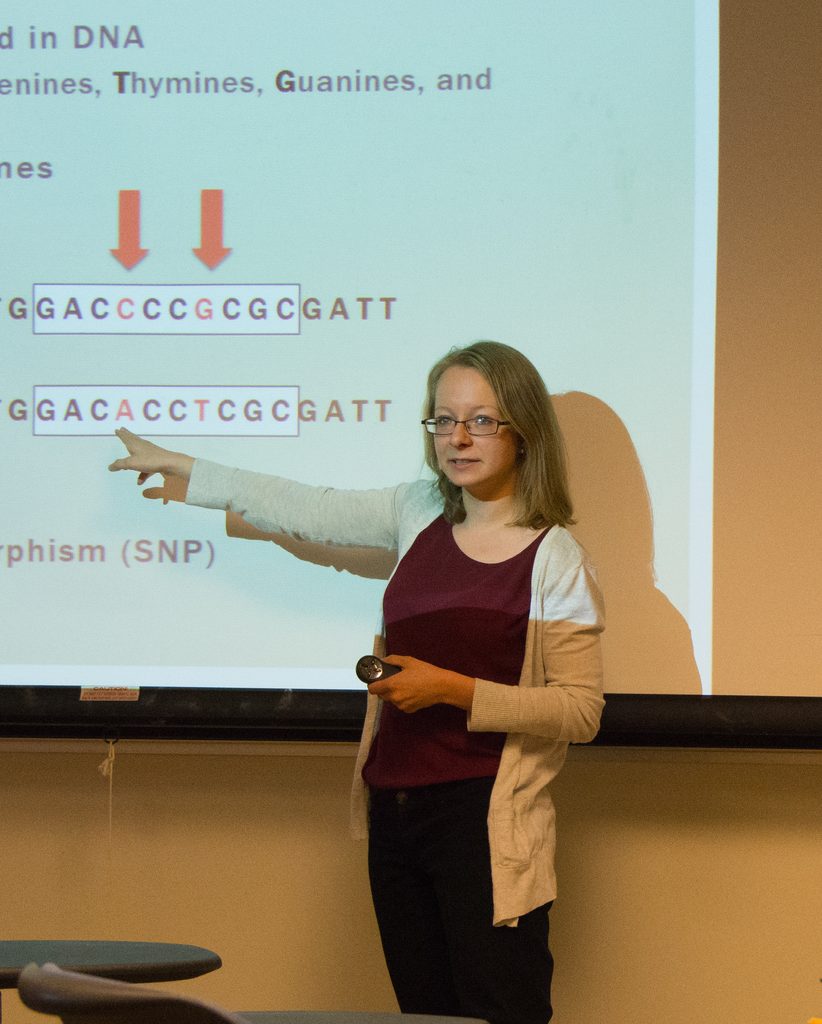
Kaitlyn Cook, Carleton
In statistical genetics, the current methods of detecting association between rare genetic variants and disease phenotypes often lack statistical power. To combat this lack of power, the use of pedigree data, in which rare variants are often more highly concentrated than in typical case-control data, has become increasingly popular.
Methods for combining multiple gene-based tests of association into a single summary p-value are also a robust approach when little a priori knowledge is available about the underlying genetic disease model. However, to date, little consideration has been given to combining gene-based tests of association for the analysis of pedigree data. We propose a flexible framework for combining any number of family-based rare variant tests of association into a single summary statistic (p-value) and for assessing the significance of that statistic.