Wall Charts from Carleton’s Collection
Nothing is in the understanding that has not before been in the senses! . . . Only through diligent observation, personal viewing and personal investigation, is it possible to banish the worst enemy of any formative teaching: verbalism.
Otto Schmeil (1860-1943)
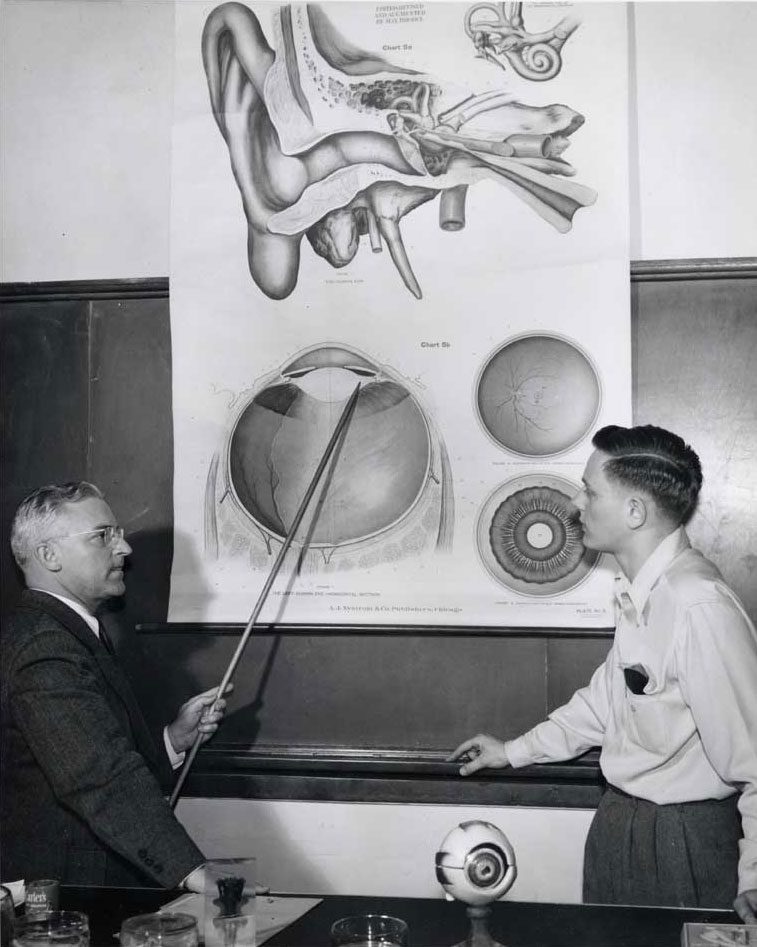
For more than a century wall charts were one of the most widely used and effective visual aids in the science classroom. The earliest wall charts, published in the 1820s, were designed for use in primary school classrooms. By the 1880s, however, wall charts were common in high schools and universities as well. Charts represented all fields of study, including botany, zoology, geology, and anatomy. The best wall charts were clearly illustrated, accurate, and large enough to allow all students to see the details of a plant or organism from their desks.
The wall charts in this exhibition all come from the collection of the Biology Department at Carleton College. Wall charts, along with magic lantern slides, were once a staple of classroom instruction here at Carleton. By the 1970s new technologies – including modern slide and, later, digital projectors – took the place of wall charts in classroom instruction. Fortunately, Alison Unger, Biology Stockroom Supervisor, took care to safely tuck away Carleton’s collection of wall charts in a storage closet. Featuring a small selection of charts from the department’s collection, this exhibition offers a unique opportunity to see what the study of biology looked like over the past century.