Plate No. 21: Rank of State and Territories in Population at Each Census
Julius Bien & Co., Lithographer
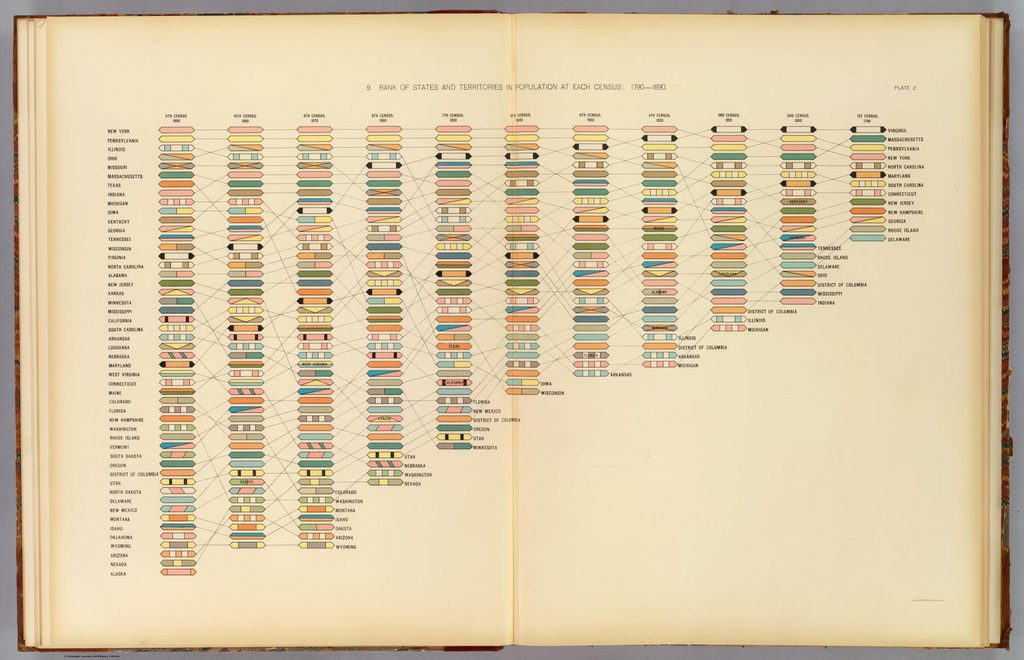
This beautiful but complex illustration ranks the states in order of population, and charts that information over time, from 1790 to 1900. The graph reads from right to left and each state is represented by a small, colored tab. For example, Virginia (a black-and-white “tab”) was the most populous state from 1790 to 1810, then steadily drops in the rankings. Texas (a solid brown “tab”), first counted in the 1850 census, was ranked fifth most populous just fifty years later.
Between 1870 and 1920, the Census Bureau produced statistical atlases for each decennial census. Famed geographer and mapmaker Henry Gannett supervised the production of these volumes, which featured charts, graphs, and beautiful maps like the one shown here. After 1930, the census ceased publishing illustrated atlases until the census of 2000, which saw the publication of The Census Atlas of the United States.
Census Office. 12th census, 1900
Washington, United States Census Office, 1903
Gould Library Government Documents