Google Analytics is an application that helps you analyze web data. The Google Analytics GUI interface allows users to download 5,000 web visit records simultaneously; the standard Google Analytics API allows 10,000 records to be downloaded at a time. However, I needed to download about a million web visit records for my organization (Carleton College). To make my work more efficient, I adopted a Python script and was subsequently able to download 100,000+ website records from Google API. There were two major steps to this process:
- Set up a Google API
- Use a Python script to pull more than 5,000 (100,000+ in my case) records from Google API, originally written by Ryan Praski.
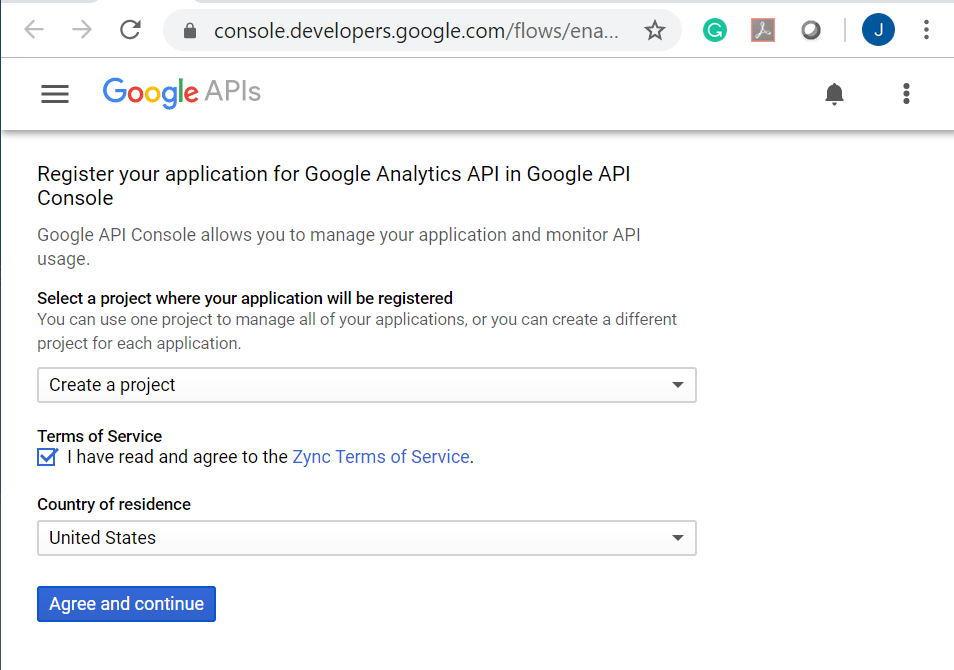
Register for Analytics API in Google Developers Console:
Visit the Google Developers Console and select “Agree and Continue”, and API will be enabled.
https://www.carleton.edu/b3564bb7-acb5-4df2-b65b-39f9a75bb593
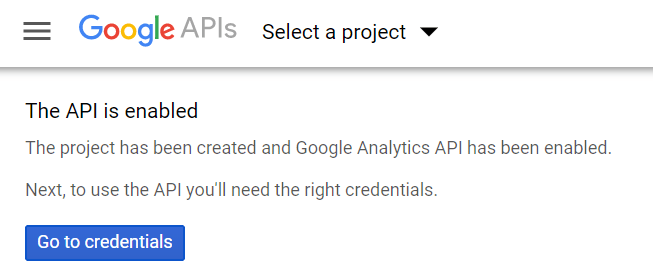
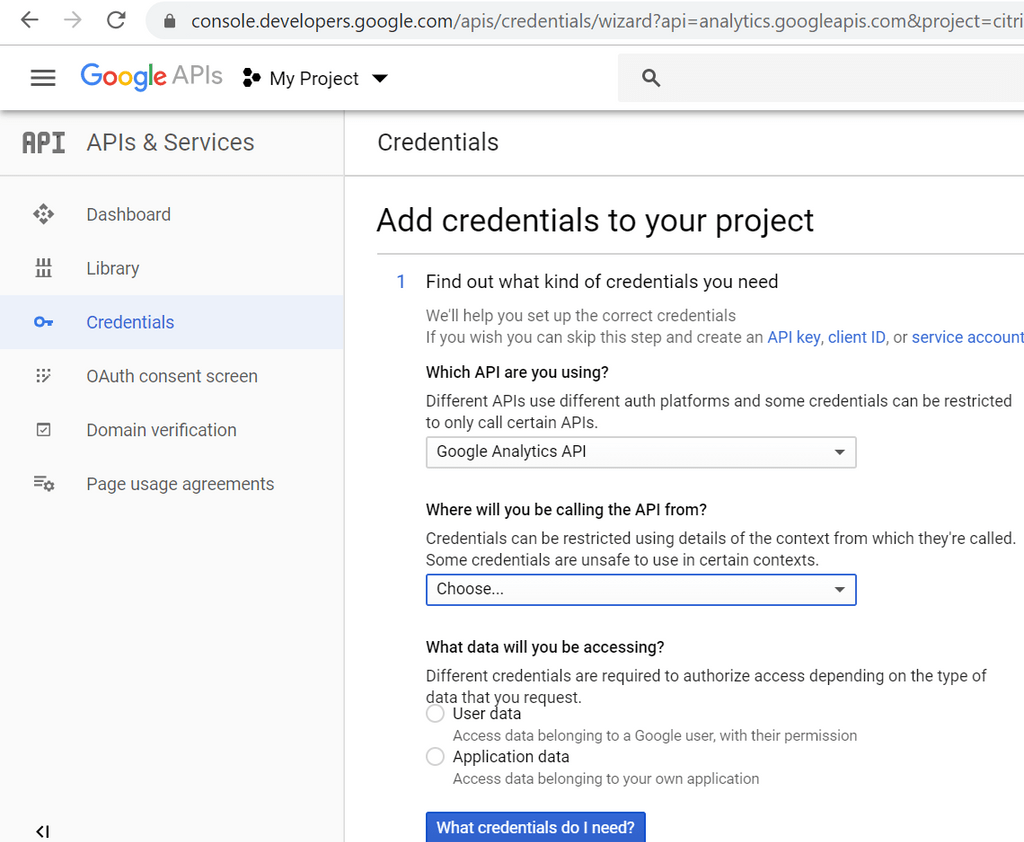
Google will then bring you to a page to set up API credentials:
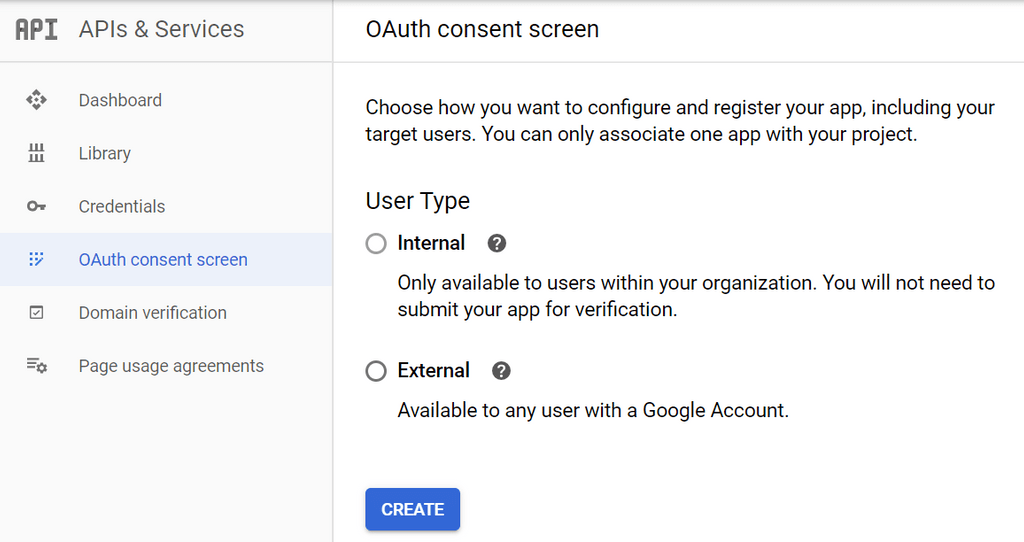
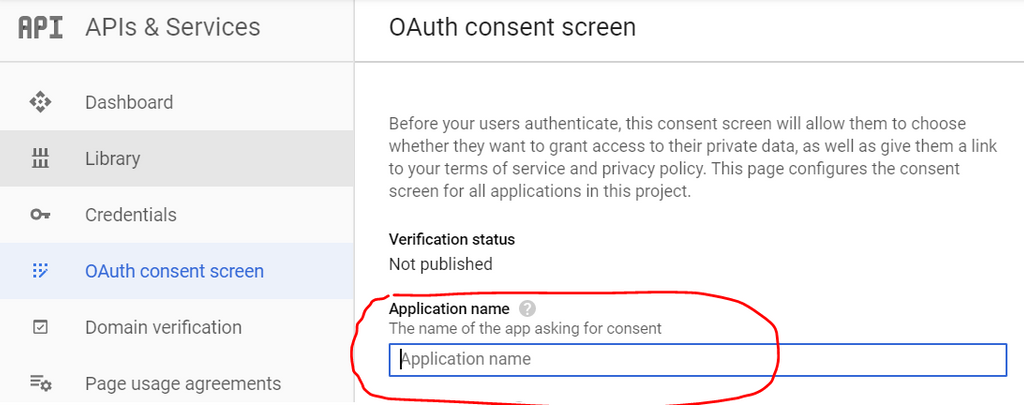
Before this is done, the OAuth Consent screen must be configured. Because I’m working for Carleton College, my API is internal. A non-Carleton account can only choose external.
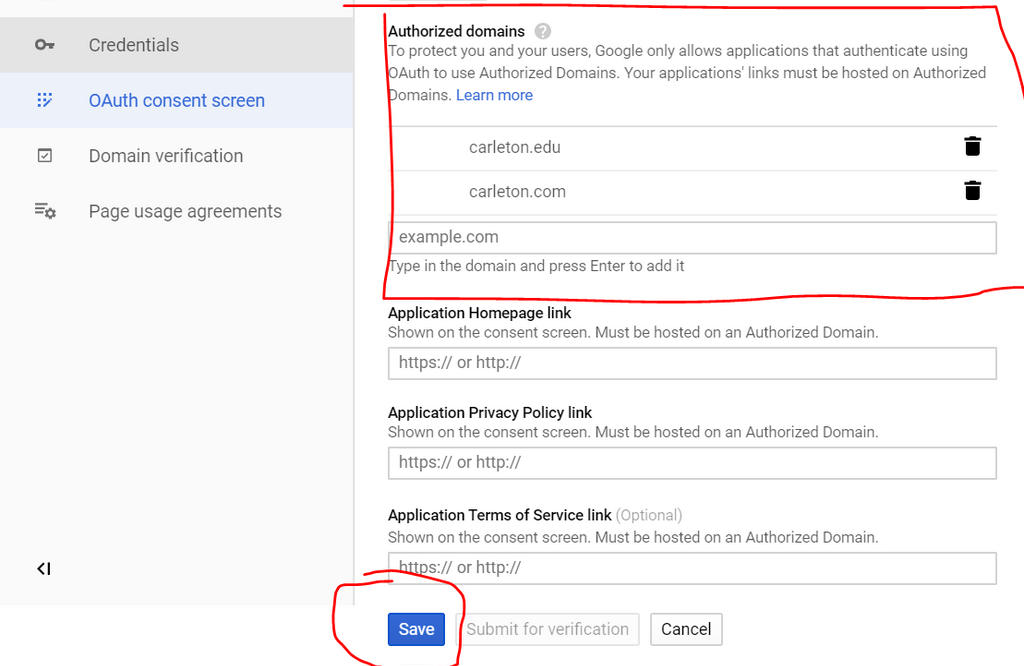
Fill in the Application name and authorized domains (the school website). The “save” button won’t appear unless both of them have been filled in.
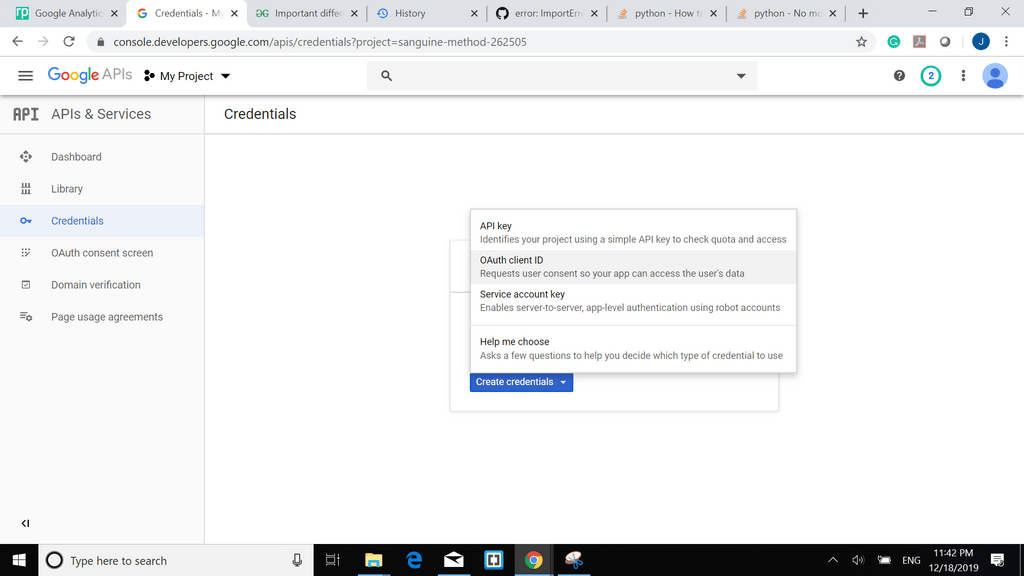
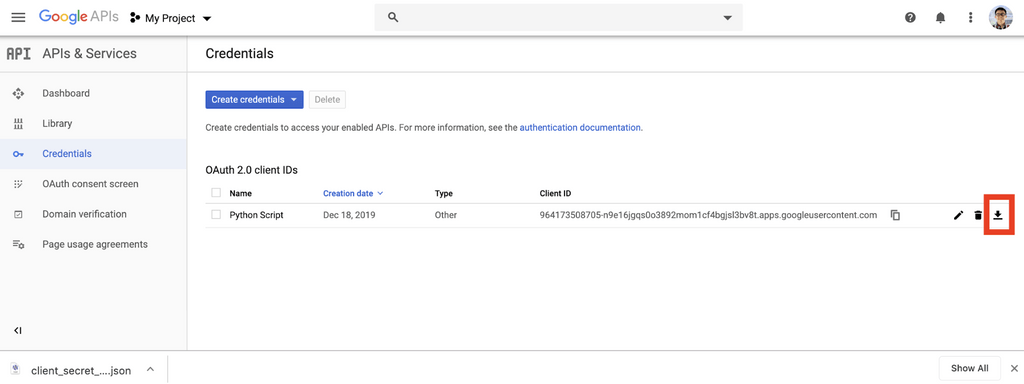
Go back to Credentials and configure the OAuth client ID as the authentication method. (When Ryan’s Python program runs, there will be a Google login window that pops up). Later, the Google API will authenticate you through a GUI Google login screen. If you prefer username and password authentication, choose the “API key” option.
Because we’re using a Python script, choose “Other” for the Application type.
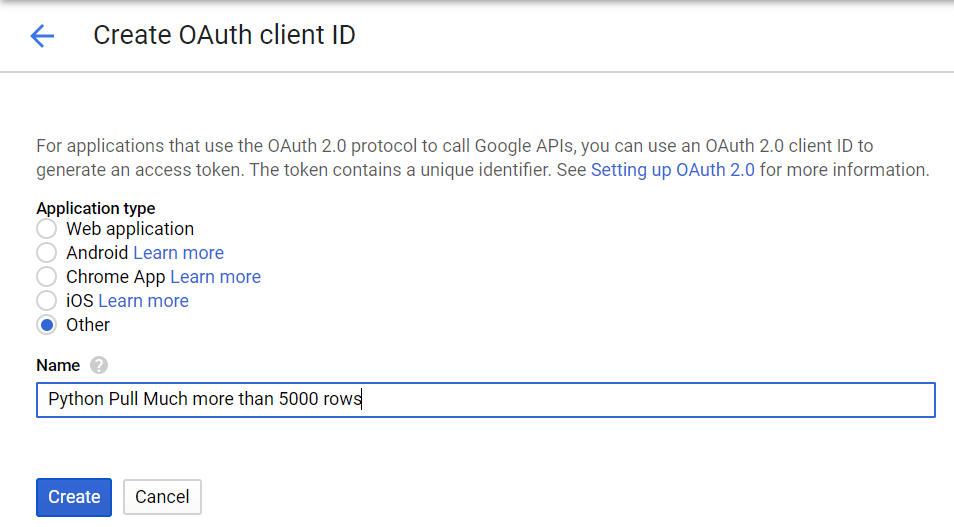
Download the JSON key file, as it will be needed later for authentification.
Download the Analytics API sample code to use Client Google API
The link to the Client Analytics API App is here: https://github.com/google/google-api-python-client/zipball/master(about 100MB). Note: the google-api-python-client in this link is out of date. Update with pip through command prompt.
Add Your Google Analytics API Client Secret Credentials
To open the Google API client samples folder that was just downloaded, go here:
\google-api-python-client-master\samples\analytics
Find the client_secret.json file that was downloaded from the Google Developer console just now. Open the client_secret.json file in NotePad++ and copy the text in the file (this has your API credentials) into the sample client_secrets.json file that was in the analytics sample folder. Delete all the original text in this sample client_secret.json file, and make sure to save the file.
Run Google Analytics Query with Python
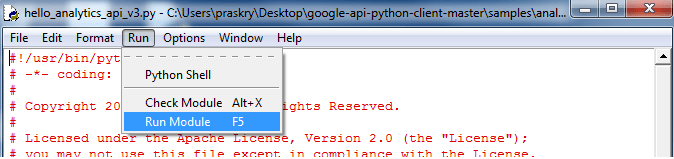
In the same folder, Right click on hello_analytics_api_v3.py and edit with IDLE. Do not double-click hello_analytics_api_v3.py. IDLE is the integrated development environment for Python.
In the top nav menu go to Run > Run Module > run hello_analytics_api_v3_module
You might get error messages like
In this case, google these errors and you’ll find codes to update it. You can solve the error above with the following commands:
pip install --upgrade google-api-python-client
pip3 install --upgrade oauth2client
Since Client Google API (supported by Google) is ever-changing, the download link is outdated. You have to continuously do updates to keep your Google API up-to-date.
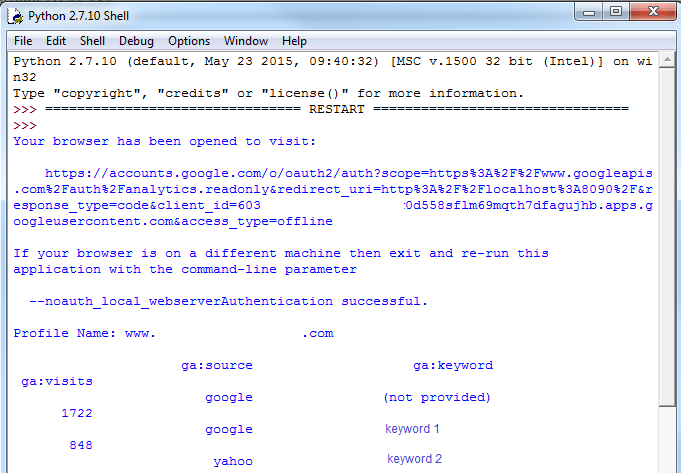
After updating the API, hit “Run Module” again. The Python shell should open and you should see a message in the shell that says “Your browser has been opened to visit: https://accounts.google.com/o/oauth2/…” run hello_analytics_api_v3_shell_authenticate.
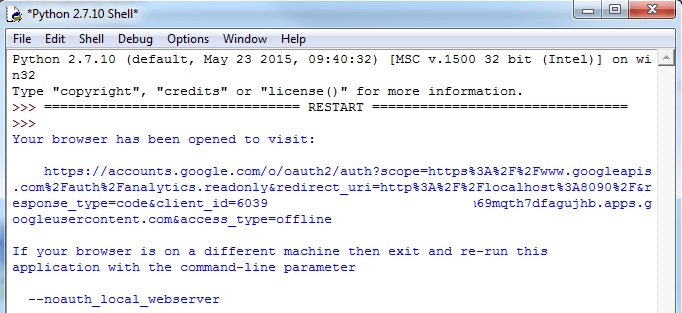
Your browser will open asking you to allow access to view your Google Analytics data for your Google Analytics Python API application. If you are logged in as multiple Google users and the application asks to authenticate for the wrong user, you can take the URL and copy and paste it into a browser window with the correct user logged in.
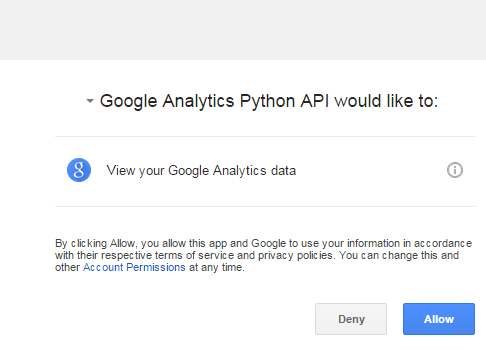
After clicking “Allow,” you will see a web page with the following message: “The authentication flow has completed”.
Play with Google Query Explorer
Although this part is not necessary to complete the project, Google Query Explorer provides a good GUI interface before you dig into Python codes. The fields that you modified in the Python script are identical to those in Query Explorer.
You will need to register. This interface is not free; it asks for your credit card information. Fortunately, it gives you a free trial of $300. I used my personal credit card because Google explicitly states they will let me know when the free trial expires before they charge my credit card.
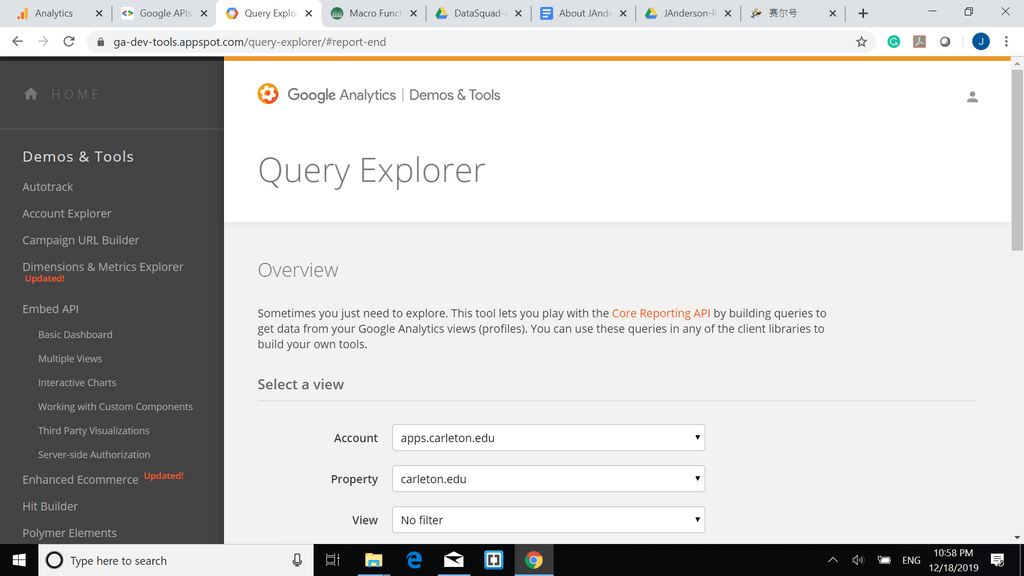
After registering and getting into Query Explorer, fill in the information as directed. Example fields may include your account information, the website that you want to look at, your desired view, and the range of data you want to look at. The metrics and dimensions are the same as in the Google Analytics account that I previously logged into.
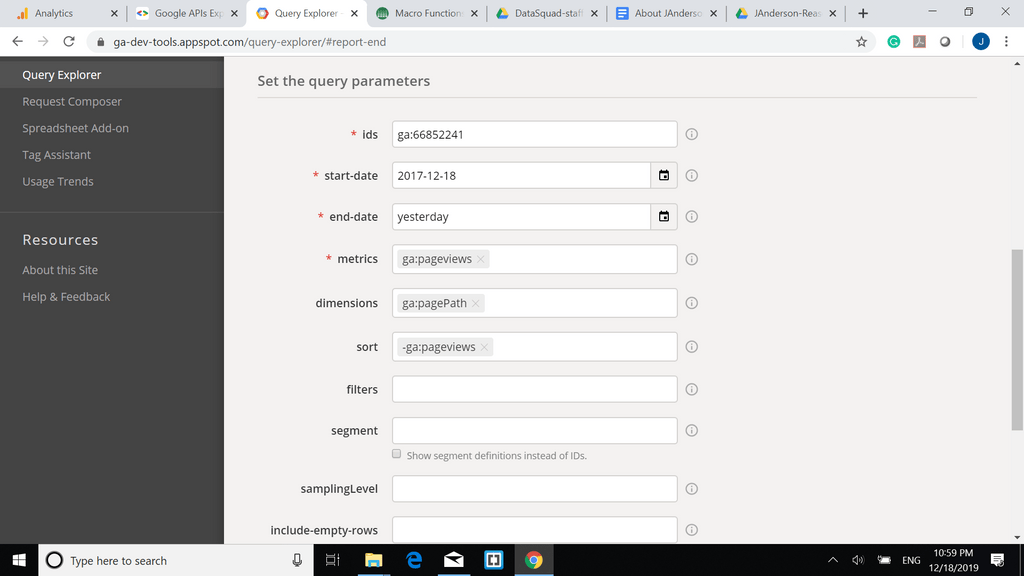
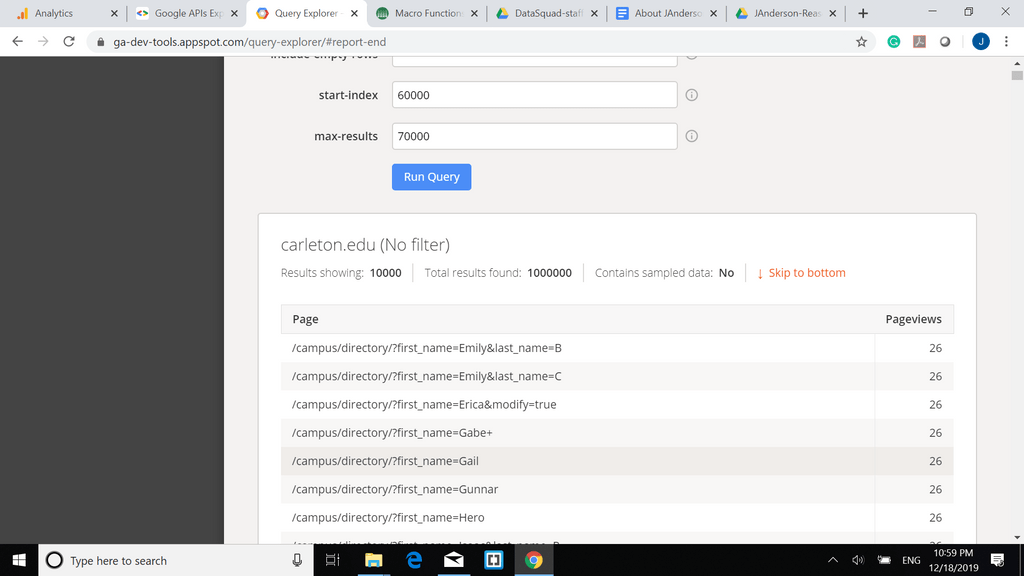
Query Explorer is better than the Google Analytics interface in that it’s faster (about 10-20 secs); you can draw up to 10,000 rows at a time, whereas in the interface you can only draw up to 5000.
Use a Python Script to Pull Much More than 5,000 rows
By now, your computer is already authenticated by Google Query. If you want to log in again, go to
C:\……\Desktop\google-api-python-client-master\samples\analytics and run hello_analytics_api_v3.py through the Google login screen again.
The actual Python script, modified for python3, that pulls 100,000 rows of records, is here, along with Ryan’s original python2 script.
Ryan’s original script and my modified script for python3 can be accessed online.
Make sure to download it in the following folder: C:\……\Desktop\google-api-python-client-master\samples\analytics
Which is the same folder as “hello_analytics_api_v3.py”.
To open the script and edit it with IDLE, you’ll need to configure a parameter similarly as done with Google Query Explorer, using the following steps:
- Go to line 162 and find
profile_ids={‘ryanpraski’; ‘1234567’}orprofile_ids = {'apps.carleton.edu': '66852241'}. Enter the profile name (the name of the output .csv file) and profile id (view ID from Google Analytics) that you want.
- Go to line 165 and enter the date range you’d like for your query. Note that this program can only get 10,000 queries from the API at a time, but it can compile multiple queries and consolidate them. So, for a large entity like the Carleton website, I can only select one month as the range.
Possible Error:
If you receive “Error: Query contains sampled data!” your query will not run.
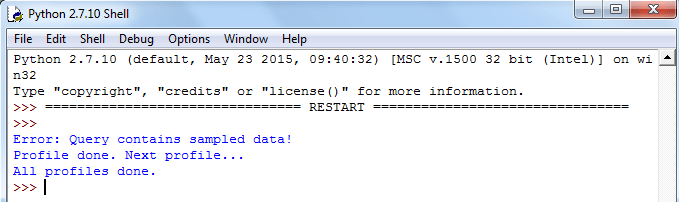
Next, shorten the date_range variable until this error message stops appearing.
There is also an option where you can select multiple ranges of dates. While the result counts, it doesn’t add up. I didn’t find it too helpful as they are counted monthly.
3. Find the filename variable on line 176. This is the name of the output .csv file. %s is a placeholder variable, where %s is the profile name in step 1. For example, my filename will be google_analytics_data_apps.carleton.edu_1.csv.
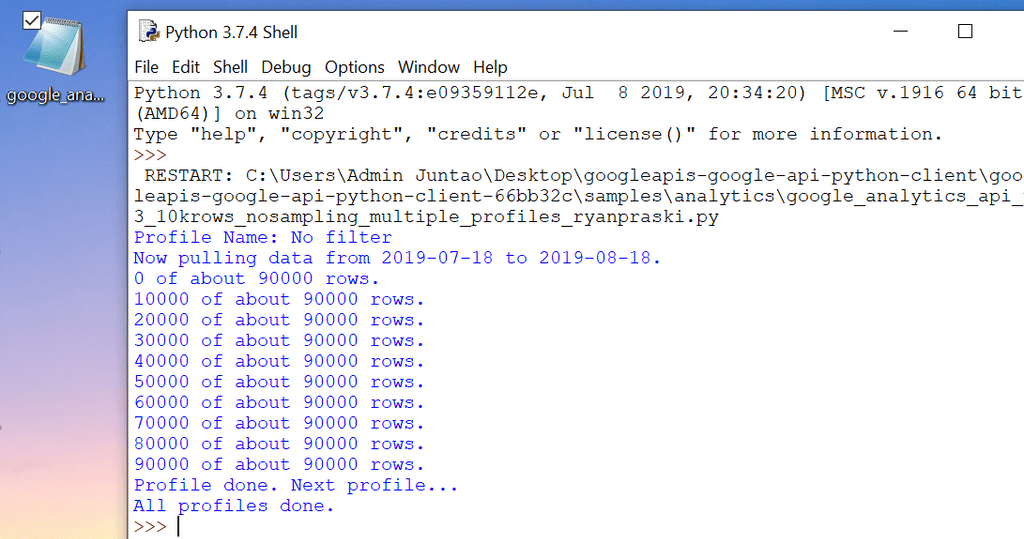
4. Using Fn + F5, run the script. If everything is right, you should see the following:
Open the .csv file with excel or any statistic software you like.
We downloaded monthly website clicks from the API into a .csv file. Next, we found a way to compile such information and poll all the monthly data into a big sheet so that we could analyze it.
Failed Approach: I attempted to make Excel read from .csv files, but one can only achieve it with Excel Macro. I didn’t want to learn Macro solely for this project, as the people using my data are not likely to have the software. As a result, I decided to use Python.
Python Approach:
I wrote a Python script named “Juntao Zhong Compiling data from Many Month Analytics“.
To use it, you’ll first put all your monthly data into a folder. Then, on line 36, change the path to direct it to your data folder. On line 55, set the path that the compiled .csv file will be created to.
Line 31 takes out the file path from the filename, so the column of the .csv file doesn’t have the file path information.
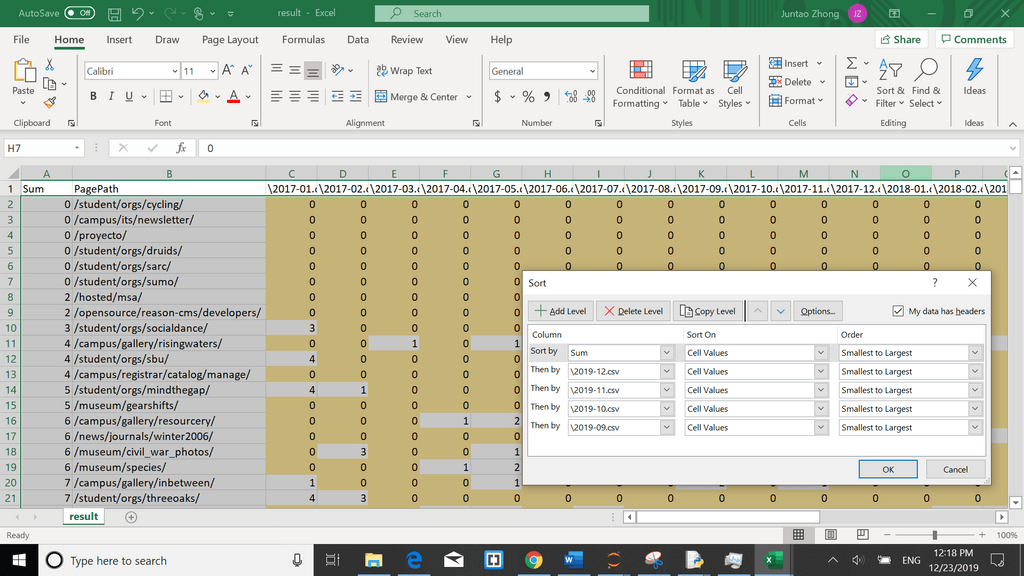
Run the Python script, and open the .csv file with Excel. You will get something like this:
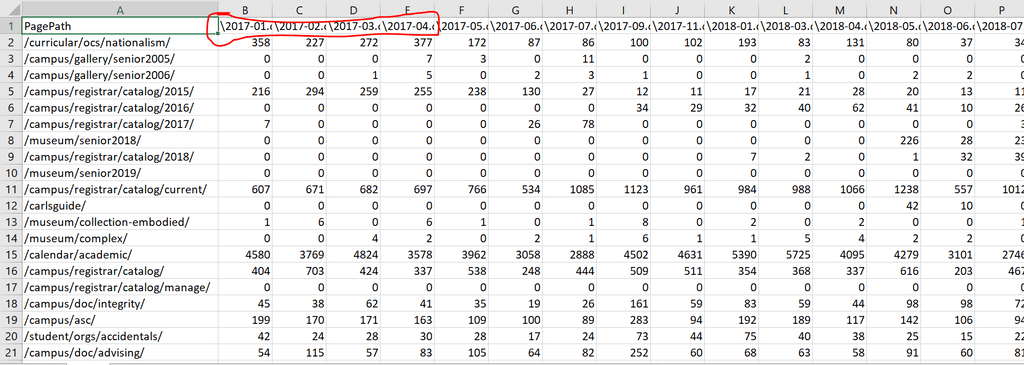
The column names refer to the data file, so it’s important to name your data files as something that makes sense.
For example, I named my file 2017-01.csv for data between 2017 Jan. to 2017 Feb.
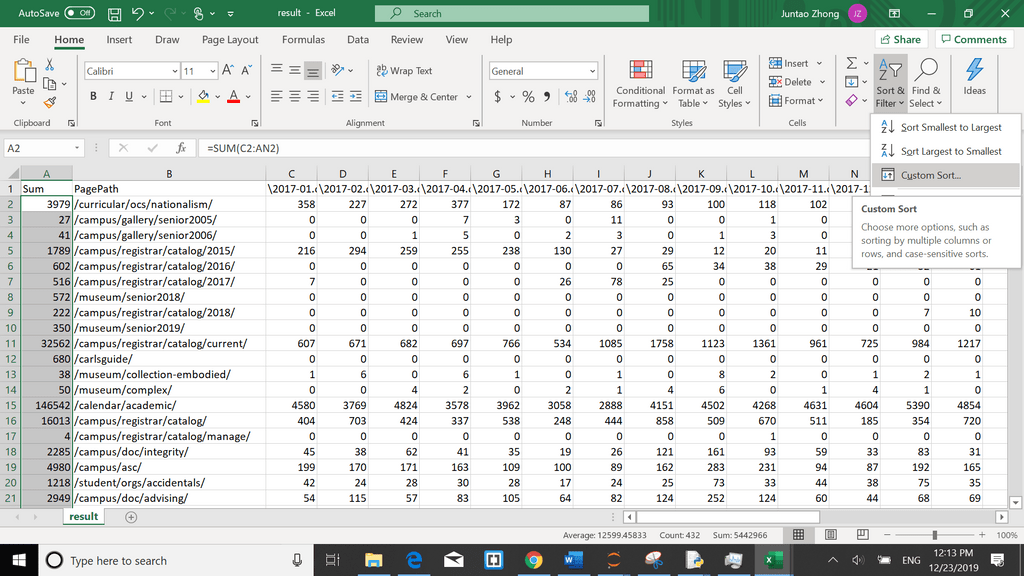
In the Excel file, you can sum up the total amount of clicks for that website for the past three years. Then, custom sort it by your desired criteria. I sorted from smallest to biggest by sum, then 2019 Dec., 2019 Nov., 2019 Oct., and finally 2019 Sept.
Also, for better visualization, I highlighted in yellow all the cells where the monthly click is 0, so it’s known that the website hasn’t been visited in a month.
This is as far as I’ve gotten on the project.