Posts tagged with “DataSquad Blog” (All posts)
First Couple of Weeks with DataSquad
I was very happy last spring when I learned I was going to start working with Datasquad this year. I have some background in data science but I wanted a…
Attending The Grace Hopper Conference 2018
From September 26th to 28th, I had the immense privilege of attending the Grace Hopper Celebration in Houston, Texas as a Scholar. As described on their website, the Grace Hopper…
Doing ‘Percent of Total’ in Tableau!
Here is an example of a bar chart with two dimensions (the blue pills) in the columns However, There are far fewer ‘home office’ records than there are ‘consumer’ records.…
Introduction to RStudio Server @ Carleton
RStudio Server allows users to access the RStudio IDE from anywhere via a web browser. Compared to the RStudio on your local machine, using the RStudio on a server has…
Attending the First SheHacks
From January 26th to January 28th, I had the honor of attending SheHacks Boston. SheHacks is… “… a 36-hour, student-run hackathon open to all female and non-binary individuals. Led by…
Language Assessment Data Visualization
The language department requested for an analysis and visualization of the data on fifty-nine 204-level students and would like to know how their starting course (101, 102, 103, or 204)…
Physics Inventory Database: Image Optimization Instructions
This is a subtask of the Carl-Olaf physics inventory database project to provide instructions and assistance to the student worker who will take photos of physics equipment and upload them…
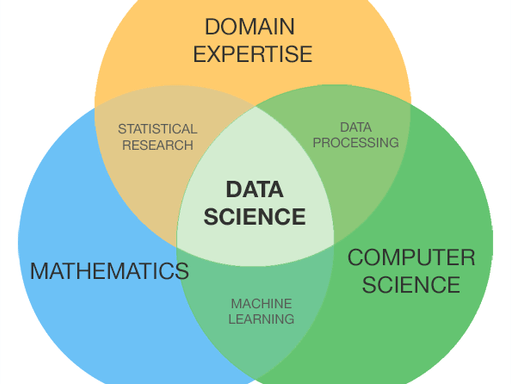
What is Data Science?
Data Science is a sometimes difficult-to-define, increasingly popular and buzzword-y professional field that encompasses the following: People have told me (namely my boss at Vertex Pharmaceuticals and a speaker who…
Using ggplot Themes For In-Print Visualization
While most of the recent conversation around data visualization has focused on optimizing graphs for online viewing (and rightfully so) , some graphs are still made for production in books.…
Categories
- AI
- Assessment and Evaluation
- Career Path
- Carleton DataSquad Alumni
- Carpentry
- Classroom Technology
- Conferences
- Cybersecurity
- Data
- DataSquad Blog (Current Category)
- Events
- Instructional Design
- Media
- Moodle
- Outreach
- People
- Projects
- Storage Design
- Student work
- Teaching and Learning
- Teaching Quickstarts
- Tools
- UDL
- Updates
- User Experience
- Video
- Visual Design
- Visualization
- Websites
- Works in Progress
- Workshops
- Wrangling
- Zoom