These charts and graphs explain the environmental and economic impacts of the Utilities Master Plan. Click to expand the graphs and view short descriptions.
UMP Charts and Graphs
#1 of 6

Central Plant Annual Emissions and Operating Cost Reduction
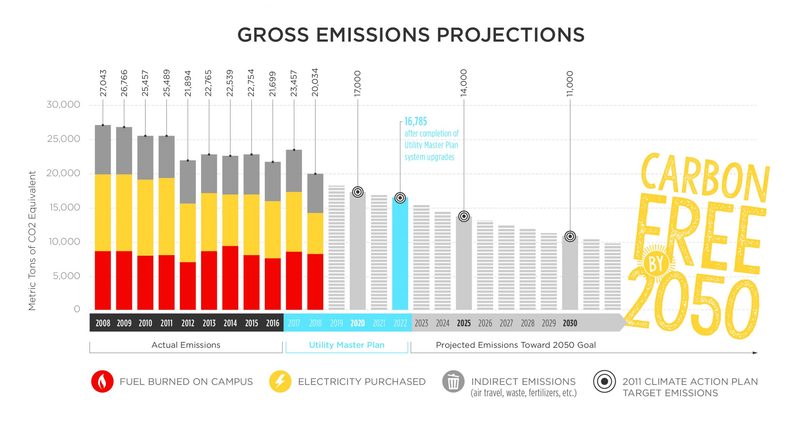
Gross emissions projections for Carleton College show that the Utility Master Plan will reduce carbon emissions to 16,785 metric tons. Remaining reductions to reach the carbon free by 2050 goal will come from future energy, waste, and indirect emissions projects.