These charts and graphs explain the environmental and economic impacts of the Utilities Master Plan. Click to expand the graphs and view short descriptions.
UMP Charts and Graphs
#2 of 6

Gross emissions projections for Carleton College.

Current Heating and Cooling Load Profile
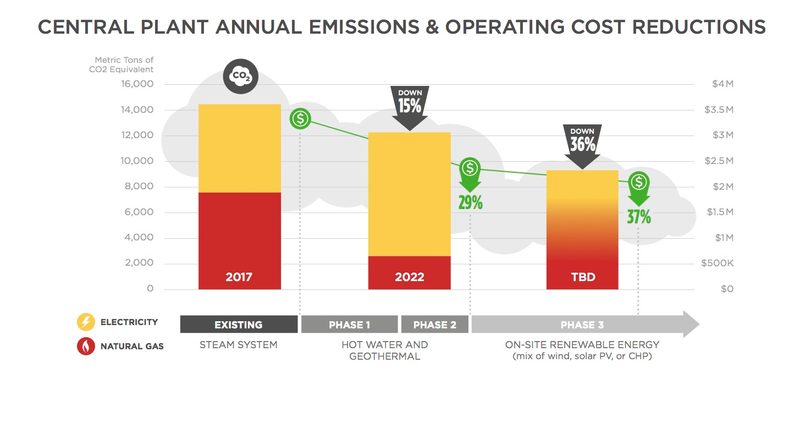
Emissions for the Central Plant, which handles heating and cooling on campus, will be reduced 15% by the new hot water and geothermal systems implemented in Phases 1 and 2.