These charts and graphs explain the environmental and economic impacts of the Utilities Master Plan. Click to expand the graphs and view short descriptions.
UMP Charts and Graphs
#5 of 6

Future Heating and Cooling Load Profile

Project Construction Timeline
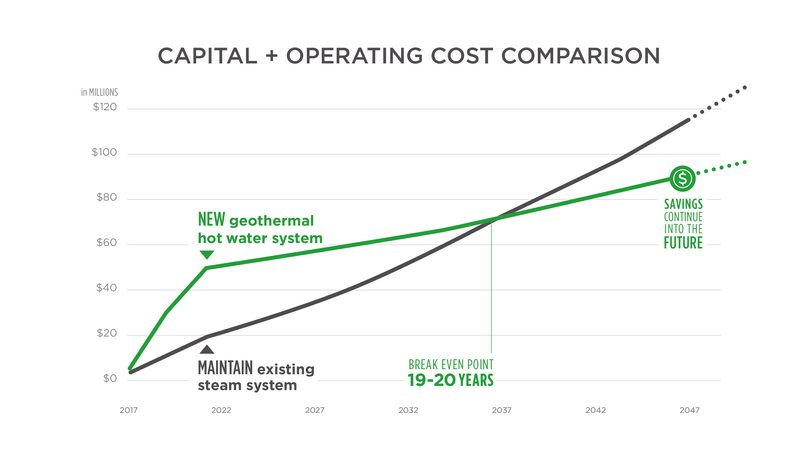
Phases 1 and 2 have a 19 year payback period. The geothermal system is expected to last for about 100 years.