Skip Navigation
CarletonHome Menu
  • Academics
  • Campus Life
  • Admissions
  • For…
    • Students
    • Faculty & Staff
    • Parents & Families
    • Alumni
    • Prospective Students
Directory
Search
What Should We Search?
Campus Directory
Close
  • Facilities Management
  • Sustainability
Jump to navigation menu
Carleton College Utility Master Plan

Charts & Graphs

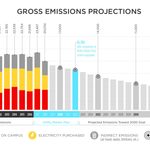
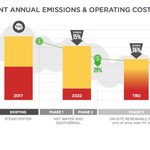
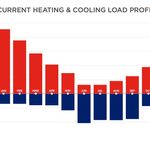
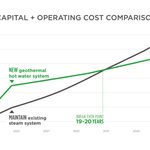
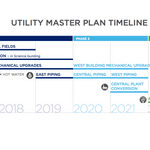
These charts and graphs explain the environmental and economic impacts of the Utilities Master Plan. Click to expand the graphs and view short descriptions.

  • Gross emissions projections for Carleton College.
    Gross emissions projections for Carleton College.
  • Central Plant Annual Emissions and Operating Cost Reduction
    Central Plant Annual Emissions and Operating Cost Reduction
  • Current Heating and Cooling Load Profile
    Current Heating and Cooling Load Profile
  • Future Heating and Cooling Load Profile
    Future Heating and Cooling Load Profile
  • 30-year Cost Comparison: Steam vs. Geothermal
    30-year Cost Comparison: Steam vs. Geothermal
  • Project Construction Timeline
    Project Construction Timeline
  • UMP Home
    • The Plan
    • Planning Process
    • Charts & Graphs
    • Frequently Asked Questions
    • Fun Facts
    • Bore Field Maps
    • Project Updates, Press & Presentations
    • Project Team
    • Carleton Utilities History
    • Curricular Connections
    • End of Steam 2021

Carleton College Utility Master Plan pages maintained by the Web Team
This page was last updated on 18 August 2020
Carleton

One North College StNorthfield, MN 55057USA

507-222-4000

  • Facebook
  • Instagram
  • YouTube
  • Twitter
  • TikTok
  • LinkedIn
  • Admissions
  • Academics
  • Athletics
  • About Carleton
  • Employment
  • Giving
  • Directory
  • Map
  • Photos
  • Events
  • News
  • for Alumni
  • for Students
  • for Faculty/Staff
  • for Families
  • Privacy
  • Accessibility
  • Terms of Use

Sign In