Below are excerpts of an interview with Lin Winton, Director of the Quantitative Resource Center, about her class “Data Visualization as Activism”, a first-year argument and inquiry (A&I) class for TRIO students. The class included an academic civic engagement (ACE) component for the first time in Fall 2021, thanks to a grant from Project Pericles.
Can you describe the “Data Visualization as Activism” class?
In this class we thought about the meaning behind the numbers. What can quantitative data do for us that qualitative information cannot and vice versa? And really, to think about the work that quantitative data can do when it comes to social change. One of the strong thrusts of the course is that data gets collected all the time about people, sometimes without their knowledge, and they often don’t ever find out where that data goes or what happens to it. Using data to do activist work can be a way to return the data to the people that it comes from. It can allow the people about whom the data is, to benefit from it and to be empowered by it themselves, so that it’s not just researchers or data journalists interpreting the data through their own lens.
What was the ACE project students worked on?
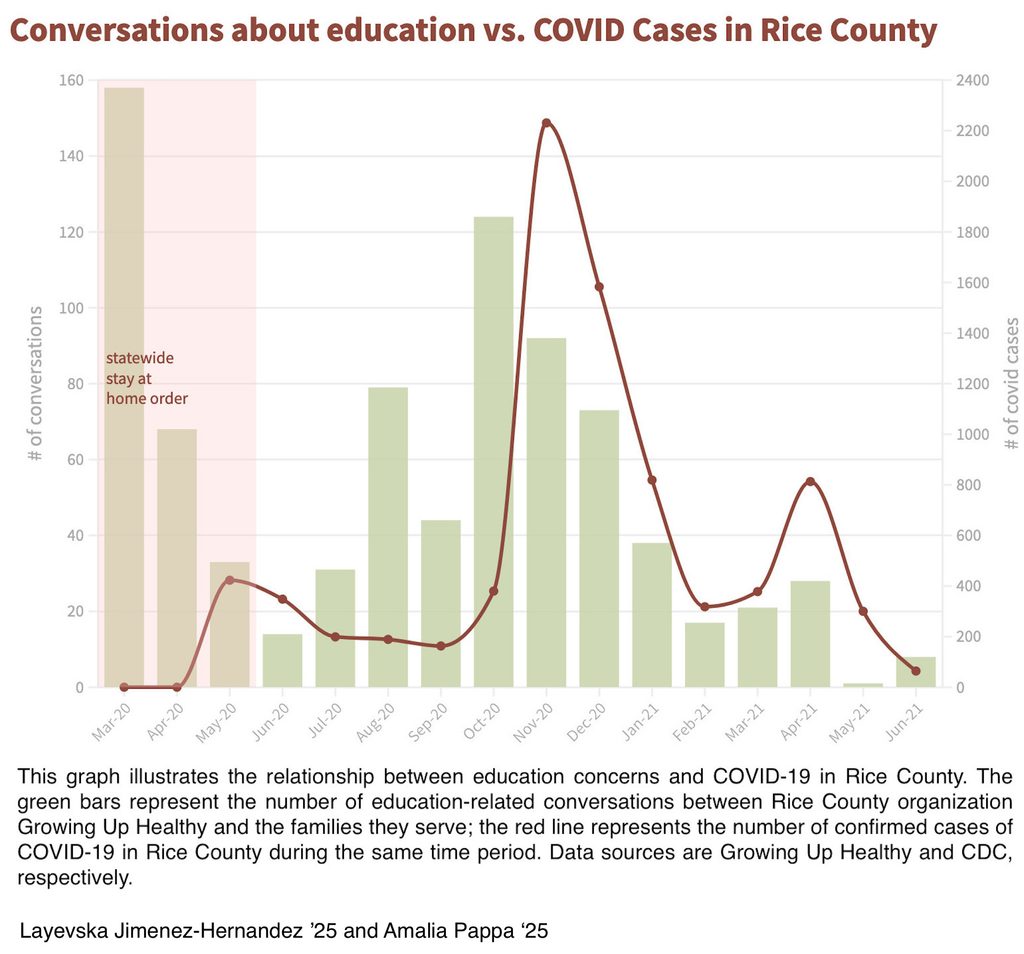
We worked with Growing Up Healthy, which is a program of the Healthy Community Initiative in Northfield and Faribault, that works with primarily Latinx families as well as those from low-income households. Often this includes immigrant families as well as families who the school districts may have a hard time getting in touch or communicating with because of language or other barriers. Growing Up Healthy tracks data related to the barriers and challenges families face when trying to work within local systems on behalf of their kids. They confidentially track information about basic conversation topics with families in a password-protected Salesforce database. Growing Up Healthy provided us with a data set — without any names or identifying information. The students took this pretty large dataset and were taught how to ask questions about it and work with the community partner to understand the needs of the community and what it is the families might be interested in with the intention of creating and analyzing some sort of question and then creating a visualization of their findings. Visualizations can be so much more accessible. It’s much less language dependent. It’s not dependent on advanced numeracy skills. And because of this, it’s a great venue for returning data back to the public. So that’s what we did. We spent the last half of the course working with Growing Up Healthy on these visualizations. The students worked in pairs, so we ended up with seven data visualizations that we presented to the staff in an event at the Northfield Community Education Center.
Why did you choose to make this an ACE class?
The students this year were all TRIO students, and that was incredibly special and powerful to have them in an ACE class. The decision to have both a TRIO A&I class and an ACE class were very intertwined to me. I wanted my students to feel like they belong, know they have a place at Carleton, know they made the right decision to be here, to see all of the kinds of knowledge, skills, and intelligence that they have to offer immediately. I also wanted them to be able to see outside the bounds of Carleton in their very first term. Leaving campus and hearing about these communities that are just a mile down the road was a shock to some of them. They had no idea because the only part of Northfield they’ve seen is downtown, which is largely middle to upper class white folks. It’s not the kind of people that a lot of them relate most to or the people that we were working with. And I wanted them to feel an at-home-ness and a confidence right away in their first term.
What were the students’ experiences of doing an ACE project?
The students having something that was real at the end, constantly motivated them. I think the students put so much more effort and care into it, not that they would have slacked, but students have to prioritize and knowing that they’re going to present this to an organization to use in grant proposals and at their community events was a huge motivator. They took it really seriously and it wasn’t just me saying, “These are real people in the data!” The fact that these were real people was constantly on their minds because at the end of the term they were presenting to the people that work with those people. That’s real. That’s real work. That’s real activism that the students did, and there’s no “toy assignment” I could have created that would have generated the same sort of weight because it just wouldn’t have been real.
What’s one of the things you’re celebrating about this class?
One of the great things about doing something that’s more interdisciplinary and more experiential is that students get to surprise you. It’s not just, “I taught you this, now demonstrate this.” We’re covering lots of things and I’m letting them bring in so much other knowledge and experience. Students have a lot to offer that I don’t know about and I definitely didn’t teach them. So they get to surprise you in that way. There were all these surprises because it was so much more open and flexible, and that was really beautiful by the end. In the last class that we had in the classroom, we did a reflection, and they were getting a little cheesy, saying things like, “We’re all friends now!” and “I actually really like all of you!” It was really touching to see the way that they had built community over the course of nine and a half weeks. I think the ACE project had a lot to do with that because we were talking about real things and doing real work together. And I think being a TRIO class had a lot to do with that.